From Nanoscale to Satellite Imaging: A Journey of Wonders
- Stephanie Tumampos

- Sep 9, 2024
- 11 min read
Updated: Oct 14, 2024

Fig. 1. Image of the PAni deposited on PG at 25000x magnification (Tumampos et al., 2010)
Photographs fascinate me. It has a unique power to immortalize a fleeting moment in time and transform it into something tangible that we can hold on to forever. Every photo creates a lasting memory, preserves emotions and keeps nuances that otherwise fade away. In these principles, you’d make a wonderful guess that I like to take pictures. I’ve been drawn to capture the world around me. From the subtleties of daily life to the magnificent views in my travels, I wanted to capture moments that would someday make me look back and remind myself that I’ve made good use of the life that was given to me. And in the grandiose of it all, little did I know that these photographs, in their stillness, would also come to symbolize the colorful journey of my career—one that spans both journalism and science. Life’s irony at play.
Yes, you read that right—science. As surprising as it may sound, this piece is going to take you on a journey quite different from the other perspectives in this issue. Don’t worry, though—while I'll be diving into some scientific concepts, I’ve made sure to keep things clear and easy to follow.
And while the connection might not seem obvious, imaging has played a crucial role in my scientific career, particularly in two different fields—materials physics and remote sensing. Both disciplines have given me unique perspectives, just as photography has allowed me to capture the world in new ways.
A peak at the nanoscale world
As a photographer, it's always amusing when I hit the limits of my trusty 70-200mm lens, unable to zoom in as much as I'd like. At best, I can get 3 to 4 times closer to my subject, but that’s still within the realm of what the human eye can see. It brings my subjects closer and creates a sense of intimacy. But what is beyond the visible spectrum?
During my college years as an applied physics student, I focused my research on materials physics. At its core, materials physics delves into understanding the structure of materials and the ability of current technology to visualize and analyze the intricacy of the building blocks of a material in a level beyond human vision, is a crucial aspect. Through this, we gain insights and improve existing technologies and hopefully, lead to groundbreaking research and development.
Imaging in this field of science is beyond our vision. If we use cameras and lenses to magnify and zoom in our subjects and areas of interest, here we use in most cases what we call a scanning electron microscope or mostly called by its abbreviation, the SEM.
An SEM is a powerful type of microscope that is a much higher level than regular microscopes. As we use light in everyday photography, the SEM uses a beam of electrons to focus on a certain area or point of the sample. An image is produced when the beamed electrons interact with the atoms of the material and knock off some of its own electrons. (Remember, an atom consists of protons, neutrons and electrons). These electrons will be collected by a detector converting them into a signal. The stronger the signal, the brighter the corresponding part of the image producing a black and white image showcasing the surface features and structure of the sample (Herrero et al., 2023).
Figure 1 presents an image from an SEM used in my college research. The image reveals layers of globular structures with noticeable gaps between them. The magnification in Figure 1 is set to 25,000x, with a scale of 1 micron, indicating that the globular objects range in size from 200 nm to 600 nm in diameter.
To give you an overview, these globular structures are part of the environmental gas sensor I developed during my research. The sensor, designed to be both cost-effective and innovative, detects ammonia through electric sensitivity. It leverages polyaniline, a liquid organic conducting polymer used in various applications such as batteries, sensors, and solar cells (Beygisangchin et al., 2024). The polyaniline is applied through a process called electropolymerization, where electrodes are immersed in a polyaniline solution while connected to an electric current. In this setup, pencil graphite (PG) electrodes, obtained from Staedler pencils, were used, allowing the polyaniline to deposit onto the PG.
The goal of the research was to create nanoscale globular structures to enhance the sensor's performance which you can see in Figure 1. More nanoscale structures mean increased interaction with ammonia molecules, resulting in improved sensor sensitivity and functionality. Figure 1 also provides a detailed view of the nanoscale morphological structure, demonstrating the effectiveness of our sensor. By visualizing these particles and the gaps between them, we can partially confirm that ammonia introduced to the sensor interacts with these particles through the spaces, leading to changes in the electrical readings.
To give perspective on the scale of these nanoparticles, let’s compare their size with the objects shown in Figure 2.
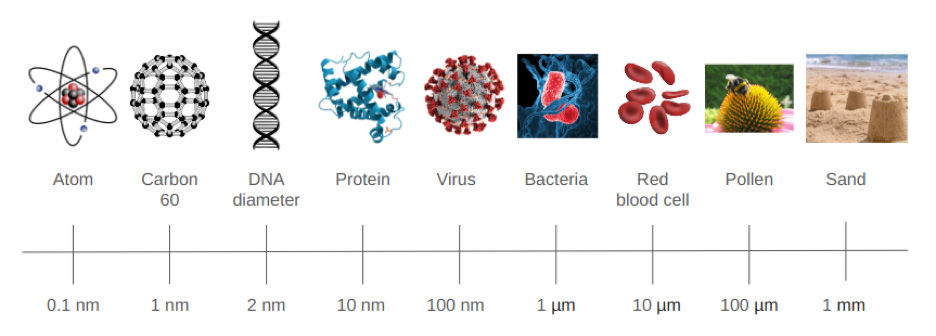
Fig. 2. A visual concept of scale showing the comparison of nanoscale objects to milli scale as based on Ismail et al., 2016.
The nanoscale is incredibly tiny and requires magnification thousands of times beyond what our visual capabilities to reveal intricate details. From the magnification in Figure 1, SEM can even offer a remarkable range of 500,000x. This extraordinary capability enables us to capture images at atomic and molecular levels.
Much like photography, SEM imaging allows us to capture and reveal the unseen dimensions of a world we seem to not see by our naked eye. It allows us to document a tangible visual and bridge the gap of what is seen (through mainstream photography) and what is unseen.
A closer look at Earth: pixel to pixel
Transitioning from the microscopic to the macroscopic, I’d like to take you readers to another different scale of imaging: remote sensing. While SEM allows us to delve deep into the smallest details of a material, remote sensing shifts the perspective entirely, capturing data and phenomena on a much larger scale, offering a broader view of our planet.
After earning my bachelor’s and master’s degrees, and navigating a few twists and turns in my photography journey, I eventually realized my true calling in research: studying the Earth. This realization led me to where I am today – back down to Earth.
Remote sensing is, in essence, “sensing” the Earth from a distance. Just like how a remote control works – you control the television without touching it and at a distance, remote sensing is a field of science that uses specialized sensors mounted on aircraft or satellites to ‘sense’, capture and record the data. This data is energy reflected or emitted by the Earth's surface. While this definition might sound like a mouthful for those not immersed in the scientific world, we’ll try to break it down.
Let me reintroduce the term - electromagnetic spectrum. It is like a rainbow of energy representing different colors that range from the light we can see and what we cannot see.
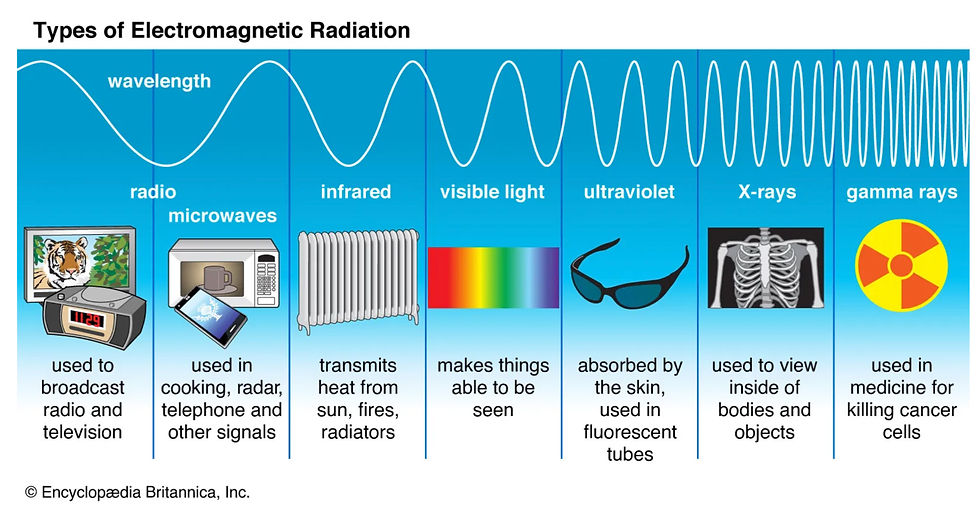
Fig. 3. A representation of the electromagnetic spectrum (“electromagnetic spectrum”, n.d.)
The electromagnetic (EM) spectrum plays a central role in what we do in photography. In photography, our camera essentially uses a sensor to absorb some of the colors of the visible light in the EM spectrum as shown in Figure 3. This means our cameras are collecting red, green and blue wavelengths for accurate color representation and renders an image that mirrors how our vision perceives the world.
The same principle goes in remote sensing, with respect to the concept of light and energy capture. Remember, light is a form of energy. And in the field of optical remote sensing, optical sensors mounted on satellites or aircrafts also capture light in the EM spectrum but extends to just the visible range. Optical sensors can also capture infrared (IR), ultraviolet (UV) and even thermal wavelengths.
Let me illustrate this for you. For instance, consider Figure 4, which shows a true color (RGB) image of part of Metro Manila, captured on April 16, 2024, with a scale of 3 km. This image was taken by the Sentinel-2 satellite, part of the Copernicus Programme, which provides optical imagery over land and coastal waters globally. The satellite has a revisit frequency of 10 days. With two Sentinel-2 satellites currently in operation and a third one recently launched and awaiting deployment, the combined revisit interval is reduced to 5 days.
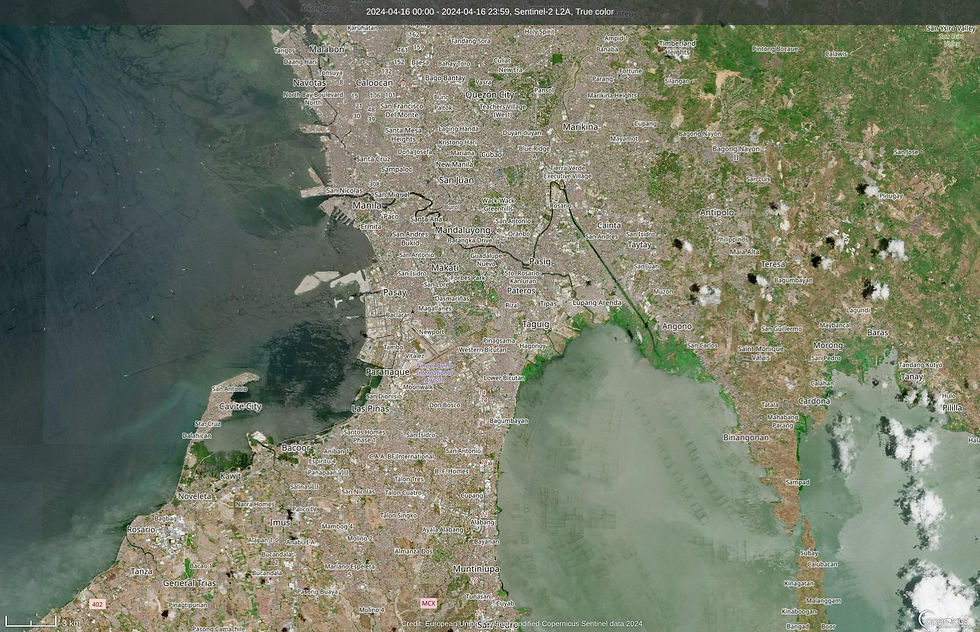
Fig. 4. True color or RGB representation of a part of Metro Manila on April 16, 2024 at 3km scale taken from the Copernicus browser with labels (https://browser.dataspace.copernicus.eu/)
Sentinel-2 represents the current state-of-the-art in satellite imaging, offering high spatial resolution. In the context of Figure 4, this resolution is 10 meters, meaning each pixel in the image corresponds to a 10-meter by 10-meter area on the ground. Additionally, Figure 4 has been atmospherically corrected, which involves preprocessing to eliminate the effects of Earth's atmosphere, providing a near-accurate spectral representation of the image. This image was accessed through the Copernicus browser, a tool that allows you to view, interact with, and download satellite imagery captured by Sentinel-2 since 2016.
As photographers, we’re likely familiar with the RGB color model used in our images, but let’s break it down visually using Figure 5. This illustration will separate the true color representation of Figure 4 into its individual red, green, and blue components.

Fig. 5. A visual representation of the RGB image breakdown of Figure 4.
In Figure 5, you'll see each color marked with a “band” and a number. In optical remote sensing, a “band” refers to a specific segment of the electromagnetic spectrum. As previously noted, remote sensing captures parts of the EM spectrum that are invisible to the human eye. Sentinel-2 utilizes 13 distinct bands, as detailed in Table 1. Each band corresponds to a spectral range that helps differentiate features within the EM spectrum.
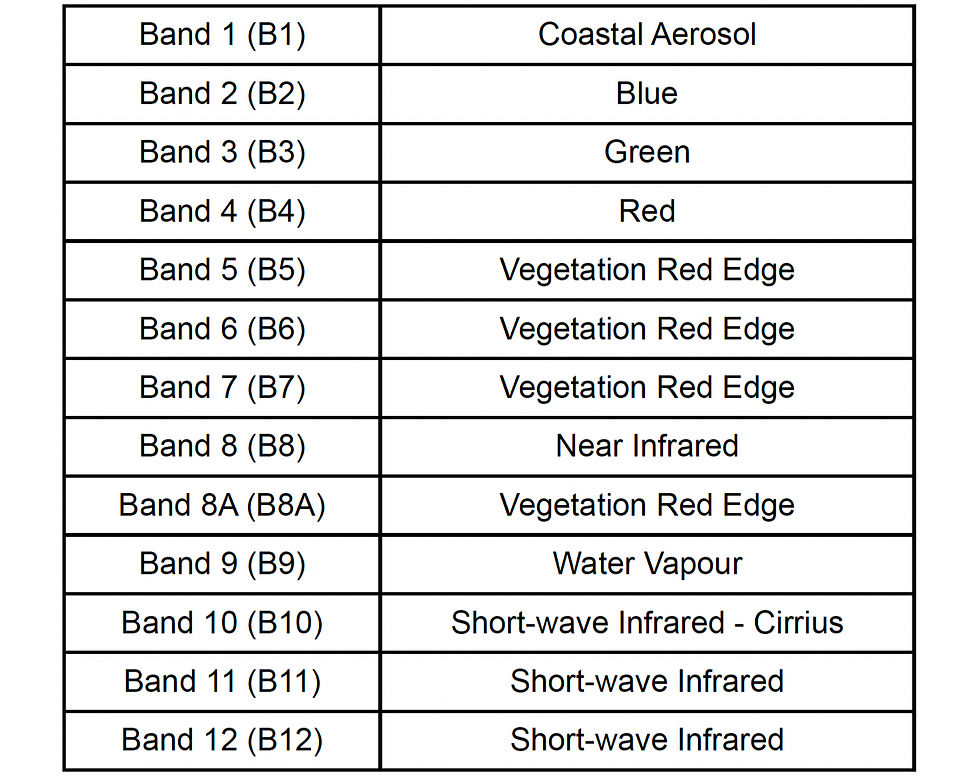
Table 1. Sentinel-2 bands
Similar to how Figure 4 provides a true color representation derived from the bands shown in Figure 5, combining the bands listed in Table 1 allows us to analyze and quantify the compositions on the ground.
Let's begin by examining the combination of B8, B4, and B3. This band composition, known as a False Color Composite or Color Infrared, is commonly used to highlight healthy and unhealthy vegetation. By utilizing B8, which effectively reflects chlorophyll, we obtain the color-infrared image shown in Figure 6.
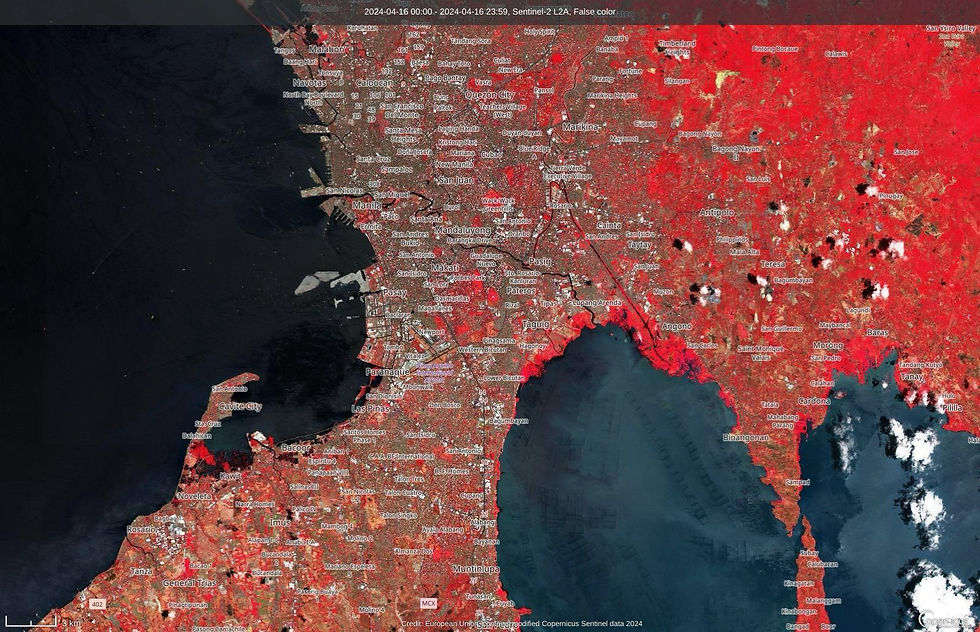
Fig. 6. A false color combination based on the same area of interest (AOI) of Figure 4 where dense vegetation appears red, urban areas are white, cities and exposed ground are gray or tan, and water is shown in blue or black.
You could immediately notice that areas beyond Antipolo are in red shade as they depict better vegetation than in main urban areas like Makati.
In Figure 7, we used a short-wave infrared (SWIR) band combination of B12, B8A, and B4. This combination reveals vegetation in various shades of green, with darker greens signifying denser vegetation and brown highlighting bare soil and developed areas.
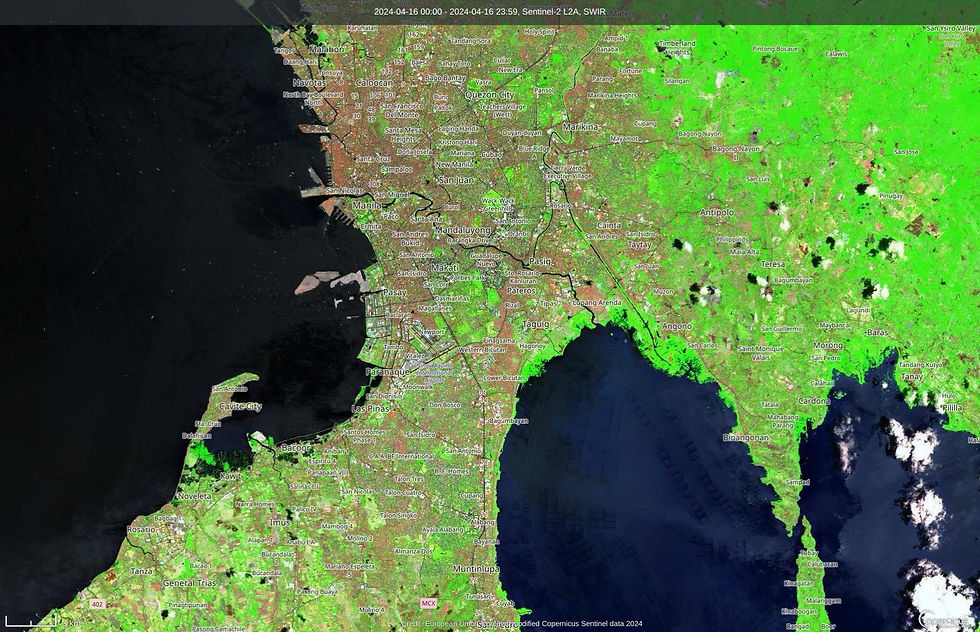
Figure 7. An SWIR combination based on the same AOI of Figure 4 where denser vegetation appears green while highlighting bare soil and urban areas as brown.
With combining bands, we’re also able to quantify each class of objects within our data image by getting the ratio of bands. We call this band indices. One of the most widely-used band indices is the Normalized Difference Vegetation Index (NVDI) which helps us quantify the amount of vegetation as shown in Figure 8. High values indicate dense canopy while low or negative values indicate urban or water features.
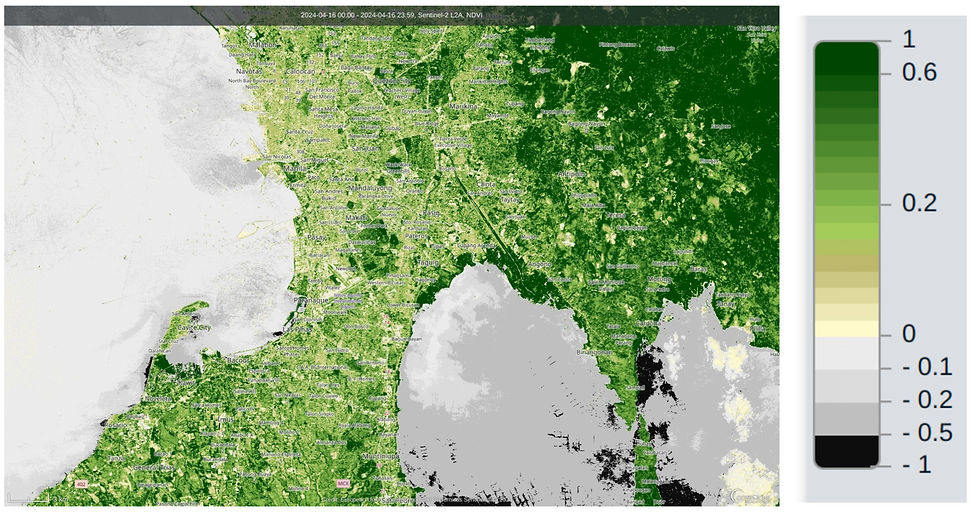
Fig. 8. The vegetation index of the AOI in Figure 4 where each shade is represented in each pixel.
Another band index is the Normalized Difference Moisture Index (NDMI) which indicates water stress in plants and can monitor drought. As shown in Figure 9, higher values in the bluer hues represent high canopy without water stress while values around zero have water stress. Negative values correspond to barren soil.

Fig. 9. The moisture index of the AOI in Figure 4 with corresponding values.
We’re also able to discriminate features of an AOI through remote sensing such as in Figure 10 where we’re able to classify areas that are vegetation and non-vegetated, clouds and their shadows, water and no data. An algorithm was used in this feature to classify features in an image.

Fig. 10. Scene classification of AOI in Figure 4.
Beyond the images I’ve shown, remote sensing provides the capability to track changes over time and observe the progression of these changes through historical data. Although not enough data on a time scale, we have a wealth of data that allows us to analyze long-term trends and refine our outputs enough to understand and get insights into our Earth’s dynamic environment. Coupled with different types of remote sensing data collected by various sensors beyond optical imaging, we have the ability to understand our planet even better by leveraging the power of artificial intelligence (AI) and machine learning.
Today, scientists use AI to manage and interpret the ever-growing volume of data. We use these data to analyze Earth dynamics including urban expansion, deforestation, pollution, migration, even weather and everything that happens on the Earth’s surface. However with approximately 807 petabytes of data currently available and projections indicating an increase of over 100 petabytes annually (Wilkinson et al., 2024), the challenge lies in utilizing this data responsibly and ethically. This includes optimizing resource use for storage and analysis, as well as managing the energy consumption and carbon emissions associated with these processes. Clearly, we have a lot to go.
The goal
Like photography where we capture moments and share it to see different perspectives, imaging at nanoscale and on an Earth observation level also provides us unique insights. Each of these fields of science I’ve done have offered different layers of detail and understanding - from zooming in the structures of materials in the smallest scale, to the expansive changes of our planet in every detail through pixels. Both these disciplines rely on different imaging techniques that are sophisticated and transform data into valuable information that drive us to improved technology and better decision making processes. While photography puts the focus on the visible, materials physics and remote sensing use their own forms of imaging process to visually give us a better understanding of things we’re not able to see by our naked eye - from the smallest material structures to the largest environmental systems and patterns.
For me, these disciplines have shown me worlds I could not have imagined. It actually makes me appreciate life more. If my life was a movie, I would be Superman as he has the supervision ability that can see through microscopic and even atomic levels, while also having the ability to fly around the world. These different forms of visualization enhance my understanding of what science could offer to help preserve this planet and of course, perhaps in my own small way and perhaps (maybe negligible), help humanity.
September 2024
References:
Beygisangchin, M., Baghdadi, A. H., Kamarudin, S. K., Rashid, S. A., Jakmunee, J., & Shaari, N. (2024). Recent progress in polyaniline and its composites; Synthesis, properties, and applications. European Polymer Journal, 210, 112948. https://doi.org/10.1016/j.eurpolymj.2024.112948
Tumampos, S., Herrera, M.U., Marquez, M.C., Pares, E. and Querebillo, C. 2010. Electrical response of electropolymerized polyaniline on pencil graphite to ammonia. Proceedings of the Samahang Pisika ng Pilipinas, 28(1), SPP-2010-3A-06. URL: https://proceedings.spp-online.org/article/view/SPP-2010-3A-06
Ismail, M., Gul, S., Khan, M., & Khan, M. (01 2016). Plant Mediated Green Synthesis of Anti-Microbial Silver Nanoparticles—A Review on Recent Trends. Reviews in Nanoscience and Nanotechnology, 5, 119–135
Herrero, Y. R., Camas, K. L., & Ullah, A. (2023). Chapter 4 - Characterization of biobased materials. In S. Ahmed & Annu (Eds.), Advanced Applications of Biobased Materials (pp. 111–143). doi:10.1016/B978-0-323-91677-6.00005-2
Britannica, T. Editors of Encyclopaedia (2024, July 29). electromagnetic spectrum. Encyclopedia Britannica. https://www.britannica.com/science/electromagnetic-spectrum
Copernicus Data Space. Retrieved September 9, 2024, from https://dataspace.copernicus.eu/
Sentinel 2 Bands and Combinations. Retrieved September 9, 2024, from https://gisgeography.com/sentinel-2-bands-combinations/
Wilkinson, R., Mleczko, M. M., Brewin, R. J. W., Gaston, K. J., Mueller, M., Shutler, J. D., … Anderson, K. (2024). Environmental impacts of earth observation data in the constellation and cloud computing era. Science of The Total Environment, 909, 168584. doi:10.1016/j.scitotenv.2023.168584
Dabarera, A., & Provis, J. L. (2023). How does Materials and Structures contribute to the UN’s Sustainable Development Goals? Materials and Structures, 56(2). https://doi.org/10.1617/s11527-023-02119-7


Comments